T-Charts are used as a simple graphical comparison or decision tool. T-Charts can be used to visually compare two products, or services, or solutions to a problem side by side.
The T-Chart can be used to easily evaluate the pros and cons of opposing views such as facts vs. opinions, advantages vs. disadvantages, or strengths vs. weaknesses.
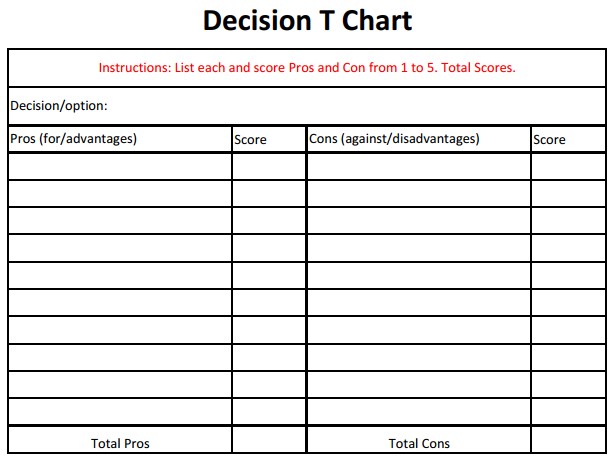
Use the left column for pros, advantages or strengths. Use the right column for cons, disadvantages, or weaknesses.
Score each pro and con from 1 to 5 according to the importance of each line item. 1 would be the lowest and 5 the highest.
Then total the scores and compare.