Control charts are used in project quality to illustrate how a process behaves over time. The data points on a control chart can be analyzed to determine if a process is within acceptable limits.
PMBOK states that when a process in within acceptable limits, it is in control and does not need to be adjusted. But, when a process is outside acceptable limits, the process should be adjusted.
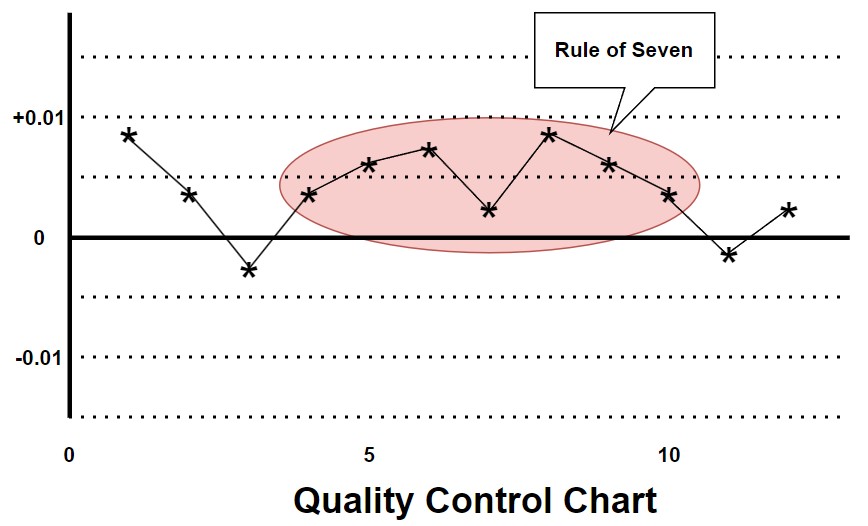
The Rule of 7 states that when 7 consecutive points are above or below the central line, the process is out of control and should be adjusted.
Here is an example of what a control chart with 7 out of control points might look like. Your charts may look different.